Graph Component
You can display a graph of a sensor value(s) using this component. The states used for the graph are stored in memory at the time the sensor updates and will be lost when the device reboots.
Examples:
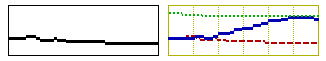
Graph component with options for grids, border and line-types.
graph:
  # Show bare-minimum auto-ranged graph
  - id: single_temperature_graph
    sensor: my_temperature
    duration: 1h
    width: 151
    height: 51
  # Show multi-trace graph
  - id: multi_temperature_graph
    duration: 1h
    x_grid: 10min
    y_grid: 1.0     # degC/div
    width: 151
    height: 51
    traces:
      - sensor: my_inside_temperature
        line_type: DASHED
        line_thickness: 2
        color: my_red
      - sensor: my_outside_temperature
        line_type: SOLID
        continuous: true
        line_thickness: 3
        color: my_blue
      - sensor: my_beer_temperature
        line_type: DOTTED
        line_thickness: 2
        color: my_green
Configuration variables

id (Required, ID): The ID with which you will be able to reference the graph later in your display code.
width (Required, int): The graph width in pixels
height (Required, int): The graph height in pixels
duration (Required, Time): The total graph history duration.
border (Optional, boolean): Specifies if a border will be drawn around the graph. Default is True.
x_grid (Optional): Specifies the time per division. If not specified, no vertical grid will be drawn.
y_grid (Optional, float): Specifies the number of units per division. If not specified, no horizontal grid will be drawn.
max_range (Optional): Specifies the maximum Y-axis range.
min_range (Optional): Specifies the minimum Y-axis range.
max_value (Optional): Specifies the maximum Y-axis value.
min_value (Optional): Specifies the minimum Y-axis value.
traces (Optional): Use this to specify more than a single trace.
legend (Optional): Configures a legend for the graph traces. See Legend Options.
Trace specific fields:
- sensor (Optional, ID): The sensor value to plot
- line_thickness (Optional): Defaults to 3
- line_type (Optional): Specifies the plot line-type. Can be one of the following:
SOLID,DOTTED,DASHED. Defaults toSOLID. - continuous (Optional): connects the individual points to make a continuous line. Defaults to
false. - color (Optional): Sets the color of the sensor trace.
Legend Options
The legend displays trace names, current values, units, and line style samples. Only one legend per graph is supported.
- name_font (Required, Font): Font used for trace names.
- value_font (Optional, Font): Font used for current values. If not specified, values are not displayed.
- width (Optional, int): Legend width in pixels. If not specified, width is automatically calculated.
- height (Optional, int): Legend height in pixels. If not specified, height is automatically calculated.
- border (Optional, boolean): Draw a border around the legend. Defaults to
true. - show_lines (Optional, boolean): Display line style samples. Defaults to
true. - show_values (Optional): Position of current values. Can be
NONE,AUTO,BESIDE,BELOW. Defaults toAUTO. - show_units (Optional, boolean): Include units with values. Defaults to
true. - direction (Optional): Layout direction. Can be
AUTO,HORIZONTAL,VERTICAL. Defaults toAUTO.
Example with legend:
graph:
  - id: temperature_graph_with_legend
    duration: 1h
    width: 151
    height: 51
    traces:
      - sensor: indoor_temp
        name: "Indoor"
        line_type: SOLID
        color: my_red
      - sensor: outdoor_temp
        name: "Outdoor"
        line_type: DASHED
        color: my_blue
    legend:
        name_font: legend_font
        value_font: value_font
        show_values: BELOW
        border: true
        show_lines: true
        show_units: true

font:
  - file: "arial.ttf"
    id: legend_font
    size: 10
  - file: "arial.ttf"
    id: value_font
    size: 8
And then later in code:
display:
  - platform: ...
    # ...
    pages:
      - id: page1
        lambda: |-
          // Draw the graph at position [x=10,y=20]
          it.graph(10, 20, id(single_temperature_graph));
      - id: page2
        lambda: |-
          // Draw the graph at position [x=10,y=20]
          it.graph(10, 20, id(multi_temperature_graph), my_yellow);
      - id: page3
        lambda: |-
          // Draw graph and legend
          it.graph(10, 20, id(temperature_graph_with_legend));
          it.legend(170, 20, id(temperature_graph_with_legend), my_yellow);

color:
  - id: my_red
    red: 100%
    green: 0%
    blue: 0%
  - id: my_green
    red: 0%
    green: 100%
    blue: 0%
  - id: my_blue
    red: 0%
    green: 0%
    blue: 100%
  - id: my_yellow
    red: 100%
    green: 100%
    blue: 0%
ℹ️ Note
Here are some things to note:
- Setting
y_gridwill expand any specified range to the nearest multiple of grid spacings.- Axis labels are currently not possible without manually placing them.
- The grid and border color is set with
it.graph(), while the traces are defined separately.- Legends are drawn separately using
it.legend()and can be positioned independently of the graph.- Legend dimensions are automatically calculated if not specified, based on font sizes and trace count.