Debug Component
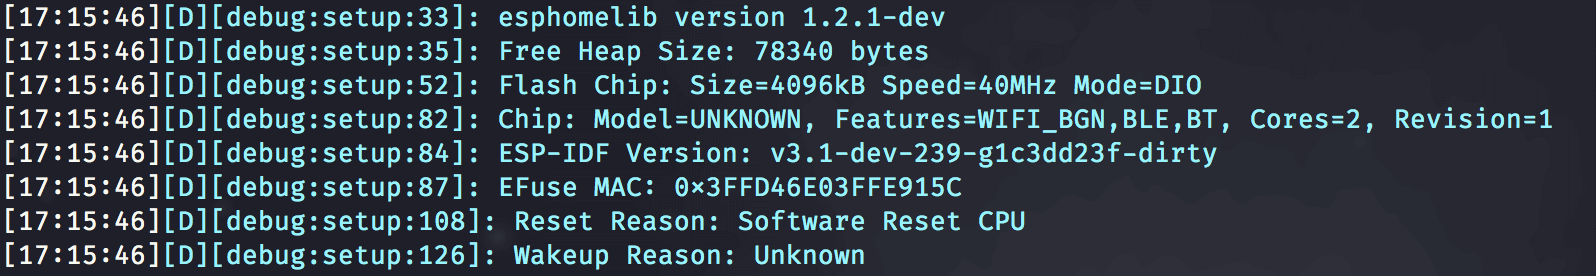
The debug component can be used to debug problems with ESPHome. At startup, it prints
a bunch of useful information like reset reason, free heap size, ESPHome version and so on.
It also allows you to get the same information as a text sensor, and to monitor the state of the
ESP heap memory (free space, maximum free block size and fragmentation level) and the main-loop timing. Monitoring can be done via the logger or web server component if it has been configured.
# Example configuration entry
debug:
  update_interval: 5s

text_sensor:
  - platform: debug
    device:
      name: "Device Info"
    reset_reason:
      name: "Reset Reason"

sensor:
  - platform: debug
    free:
      name: "Heap Free"
    fragmentation:
      name: "Heap Fragmentation"
    block:
      name: "Heap Max Block"
    loop_time:
      name: "Loop Time"
    psram:
      name: "Free PSRAM"
    cpu_frequency:
      name: "CPU Frequency"
Text Sensor

Configuration variables
device (Optional): Reports the following device information:
ESPHome Version
Free heap size at startup
Flash chip size, speed and mode
ESP32:
- Chip model, cores, revision
- Chip features (BLE / BT / WiFi_BGN / EMB_FLASH / EMB_PSRAM / …)
- ESP-IDF version
- EFuse MAC
- Reset reason
- Wakeup reason
ESP8266:
- Chip id, frequency
- Flash id
- SDK, Core & Boot versions
- Reset reason & information
Accepts all options from Text Sensor.
reset_reason (Optional): Reports the last reboot reason in a human-readable form. Accepts all options from Text Sensor.
Sensor
Configuration variables
free (Optional): Reports the free heap size in bytes. All options from Sensor.
fragmentation (Optional): Reports the fragmentation metric of the heap (0% is clean, more than ~50% is not harmless). Only available on ESP8266 with Arduino 2.5.2+. All options from Sensor.
block (Optional): Reports the largest contiguous free RAM block on the heap in bytes. All options from Sensor.
loop_time (Optional): Reports the longest time between successive iterations of the main loop. All options from Sensor.
psram (Optional): Reports the free PSRAM in bytes. Only available on ESP32. All options from Sensor.
cpu_frequency (Optional): Reports the CPU frequency in Hz. All options from Sensor.
Zephyr
The component enables debugging features for ESPHome devices running on the Zephyr RTOS. It helps with low-level firmware debugging using SWD (Serial Wire Debug). It enables:
Thread Awareness in GDB
Injects Zephyr thread metadata so that all active threads can be inspected via GDB when connected over SWD.Real-Time Logging over RTT
Enables logging output over SEGGER RTT (Real Time Transfer), allowing non-intrusive debug logs through SWD.
See Also
- Sensor Filters
- Logger Component
- Troubleshooting - Troubleshooting guide for debugging crashes and boot failures
- API Reference